27 Extreme Fear episodes since 2018. A median Bitcoin return of −3.9% over the next 180 days, against +13.6% for all days. And days with the same 30-day drop but no Extreme Fear did at least as well.
The short version, for the people who will only read this far:
- In our data, Extreme Fear added nothing beyond the price drop itself. Days with the same 30-day drop but no Extreme Fear did at least as well, at every horizon we tested.
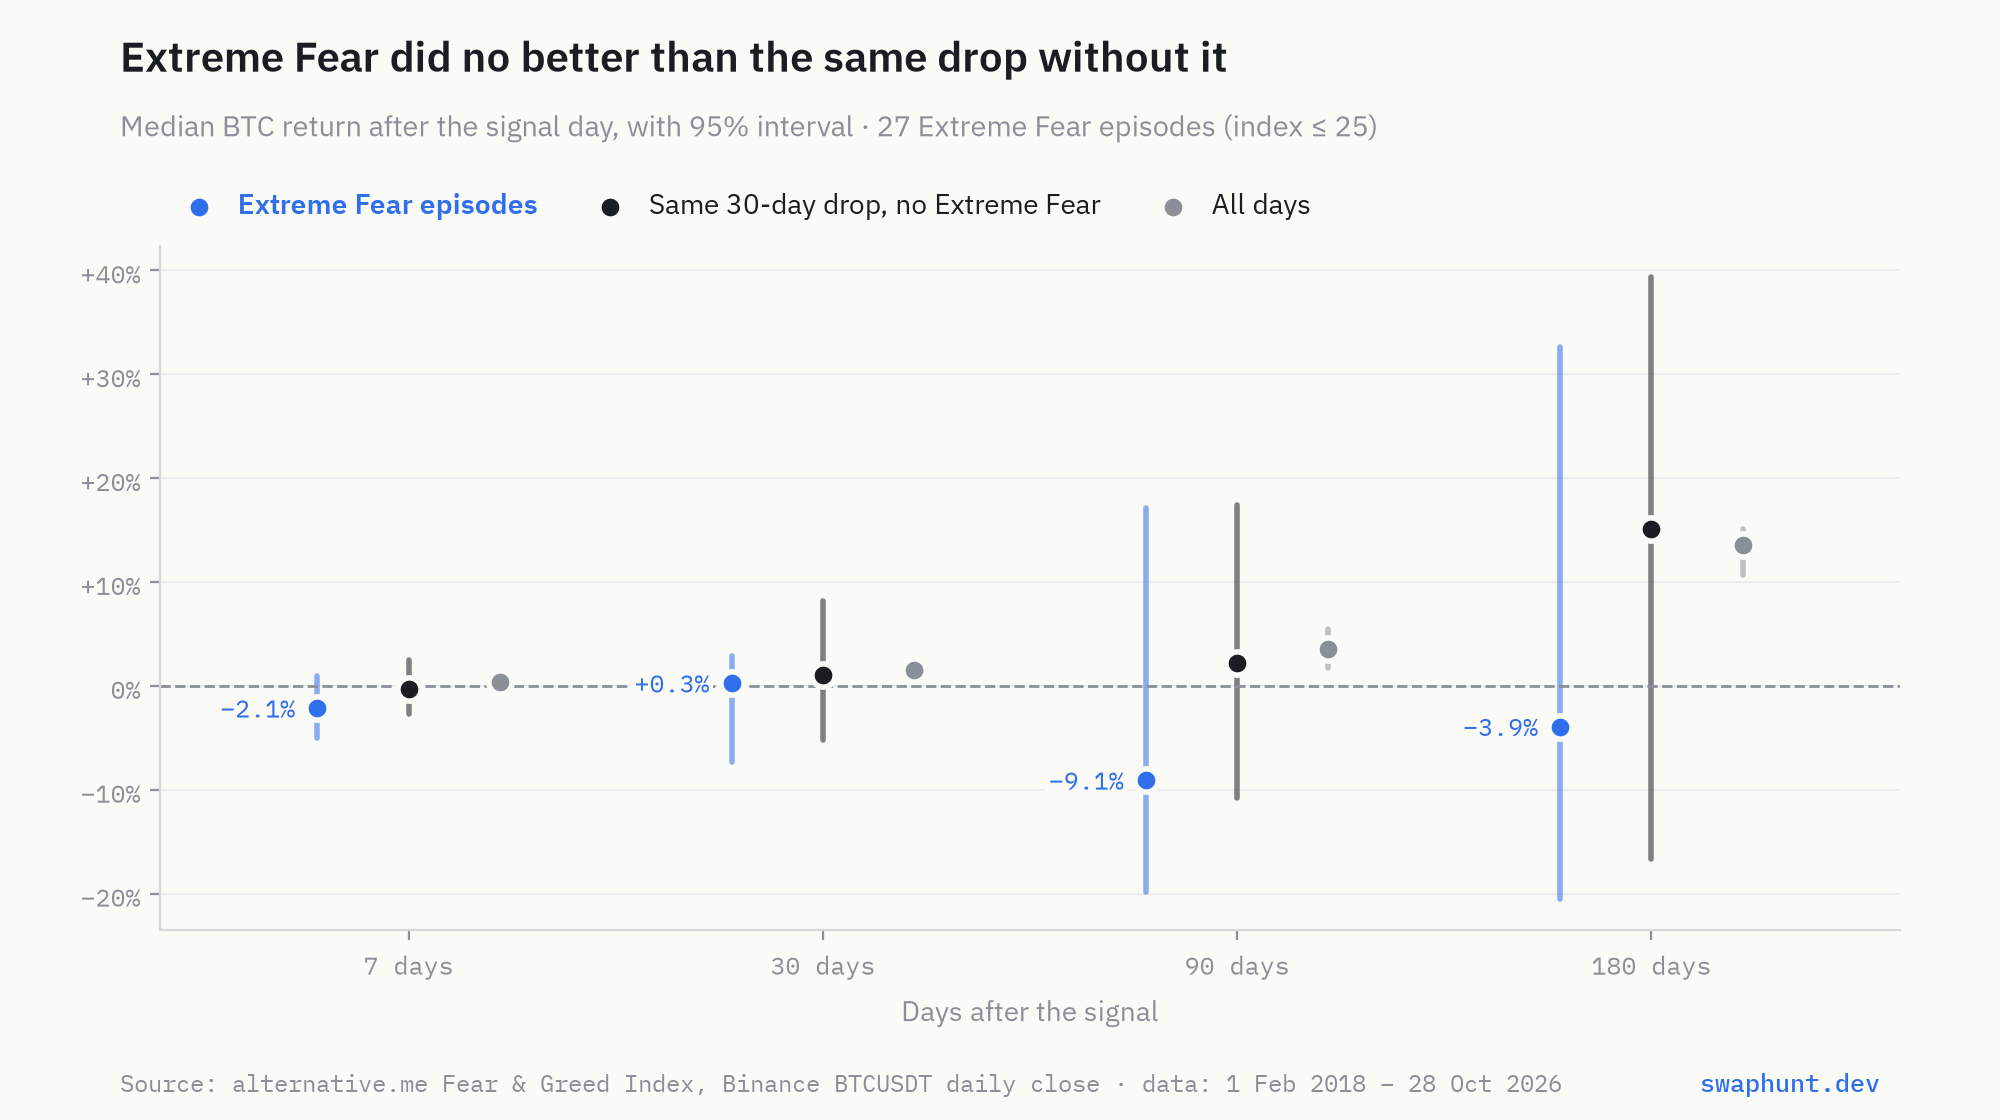
- After an Extreme Fear episode, the median Bitcoin return was −2.1% after 7 days, +0.3% after 30, −9.1% after 90 and −3.9% after 180. All days: +0.4%, +1.6%, +3.5% and +13.6%.
- The uncertainty is large. With 27 episodes, every 95% interval crosses zero. This is not proof that Extreme Fear is a bad signal. It is the absence of evidence that it is a good one.
- The bad 180-day number is mostly 2018. Remove that year and the median becomes +22.1%, and Extreme Fear and the same drop without it end up roughly level. Either way, the fear added nothing you could rely on.
- Extreme Greed: too few episodes, and the sign flips with the episode definition. We can't say anything.
Why we built this
“Be fearful when others are greedy, and greedy when others are fearful” is probably the most repeated line on crypto Twitter. The Crypto Fear & Greed Index from alternative.me turns it into a number every day, and every time it drops into Extreme Fear, someone posts that it is time to buy.
The question is simple: what did Bitcoin actually do after Extreme Fear? And the harder one: was it the fear that mattered, or just the fact that the price had already fallen?
Data and method
Data. The Fear & Greed Index from alternative.me, daily from February 2018 to October 2026 (3,189 days; 4 days are missing from the source). Bitcoin prices are daily BTCUSDT closes from Binance.
Signal. We use the index's own labels: Extreme Fear is a value of 25 or below, Extreme Greed 76 or above. An episode starts on the first day in the zone after at least 14 days outside it. That gives 27 Extreme Fear episodes and 14 Extreme Greed episodes. Days inside the same episode are not counted again, because they are not independent.
No look-ahead. The index value for a day is published at 00:00 UTC. We buy at that day's close and measure the return 7, 30, 90 and 180 days later.
Three comparisons.
- All days: the return from every day in the period.
- Random days: 10,000 draws of 27 random days, to see where the episodes fall by chance.
- The same drop without the fear: for each episode, a random day that was not in Extreme Fear but had a similar 30-day price change (within ±5 percentage points). Repeated 10,000 times. This is the comparison that separates the fear from the drop.
Uncertainty. We report medians with 95% bootstrap intervals, not p-values. Every episode is listed in the table under “Every episode” below.
We fixed the main definitions before looking at any returns. The extra checks (excluding days near an episode, and leaving out 2018) were added during review, and they are all reported. Fees and slippage are not included: this measures what the price did, not a trading strategy.
Get new research by email. No spam.
Subscribe →What the data shows
| Days after the signal | Extreme Fear episodes | 95% interval | Same drop, no Extreme Fear | All days |
|---|---|---|---|---|
| 7 | −2.1% | −5.0% to +0.9% | −0.3% | +0.4% |
| 30 | +0.3% | −7.3% to +2.9% | +1.0% | +1.6% |
| 90 | −9.1% | −19.8% to +17.1% | +2.3% | +3.5% |
| 180 | −3.9% | −20.5% to +32.6% | +15.2% | +13.6% |
At no horizon did buying after Extreme Fear beat buying on an average day (including 2018). And at every horizon, buying after the same drop without Extreme Fear did at least as well. Only 46.2% of the episodes were up after 180 days.
The spread is enormous. After 180 days the worst episode was down 51.5%, while one in ten was up more than 66.1%. Which of those you got depended on the year.
When it happened
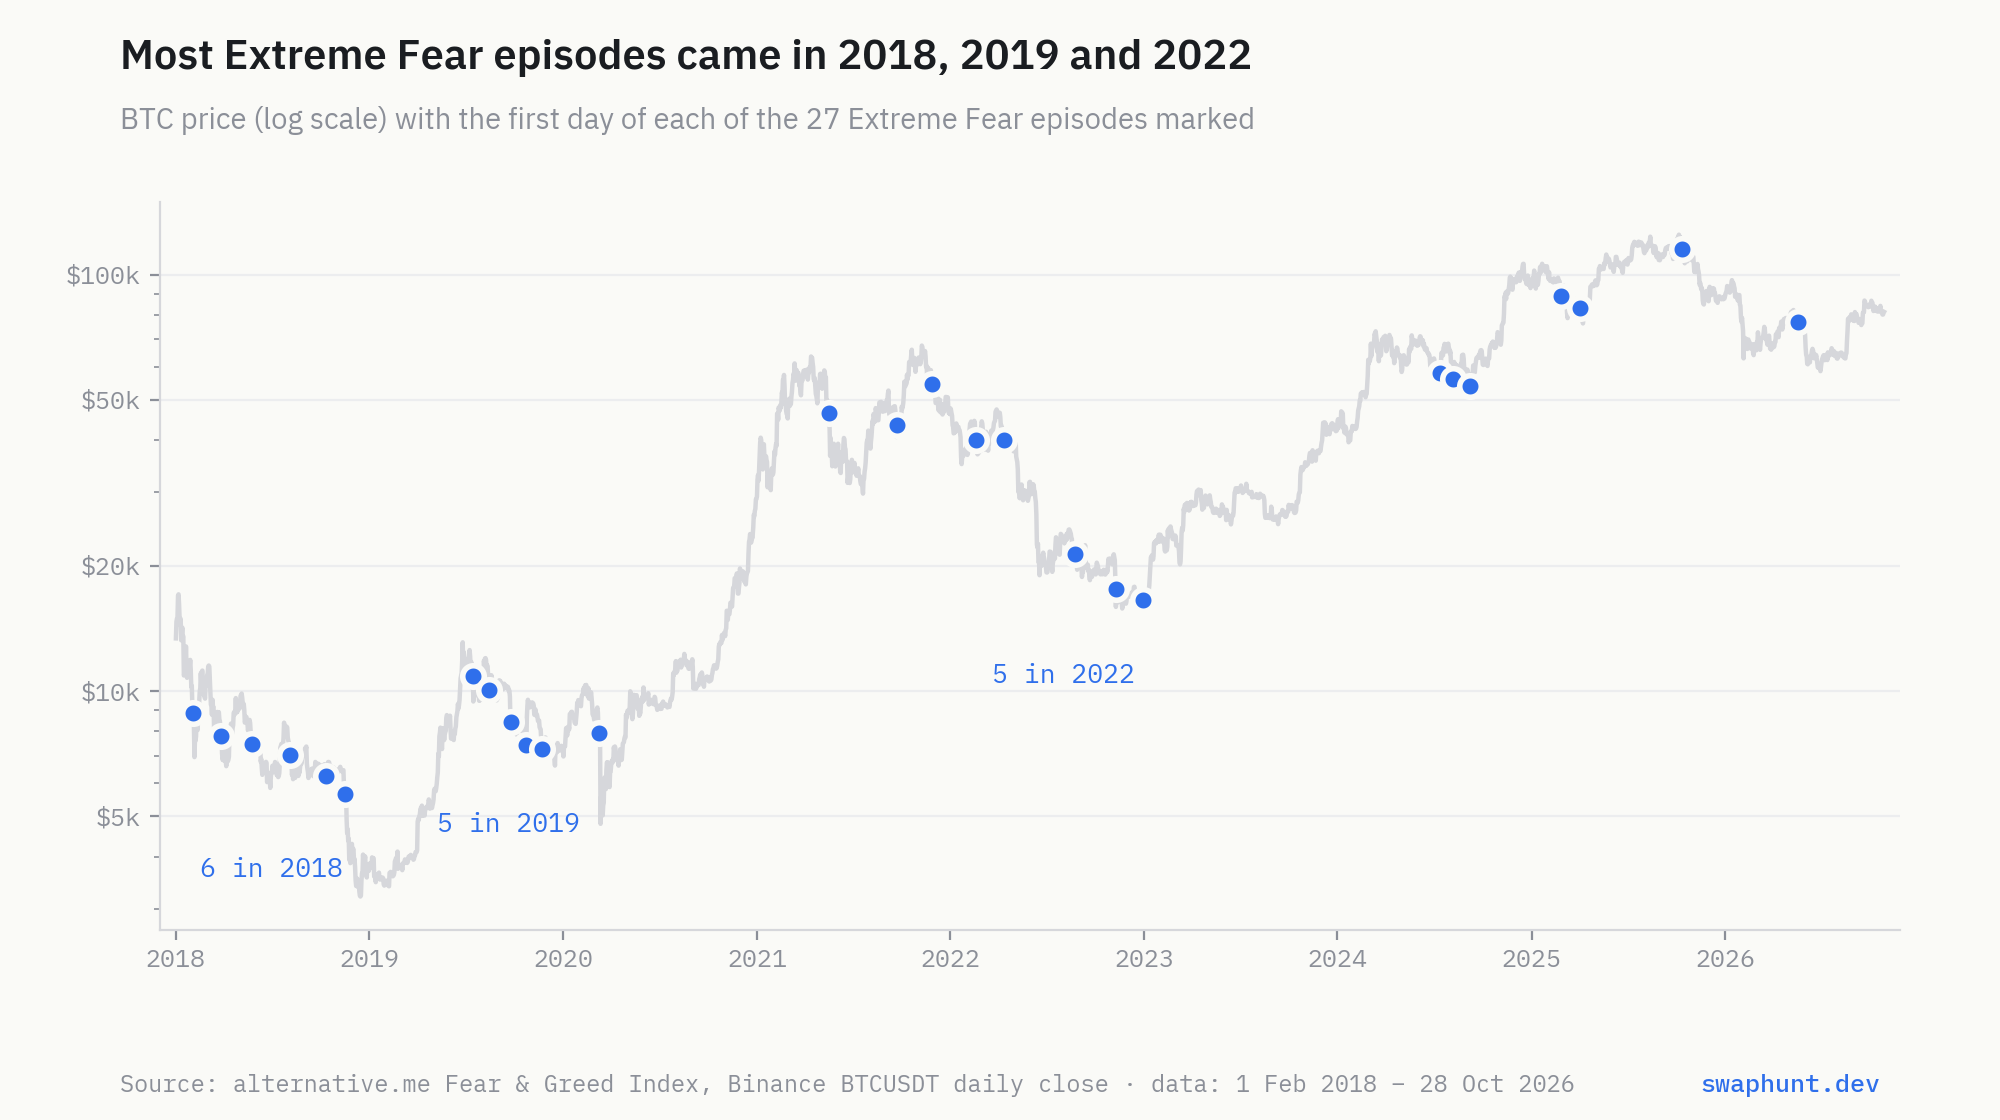
Extreme Fear clusters. Six episodes came in 2018, five in 2019 and five in 2022. That is 16 of the 27, mostly in long bear markets, where the next fear was usually followed by more falling prices. The COVID crash in March 2020 is a single episode and does not carry the result.
Does one year carry the result?
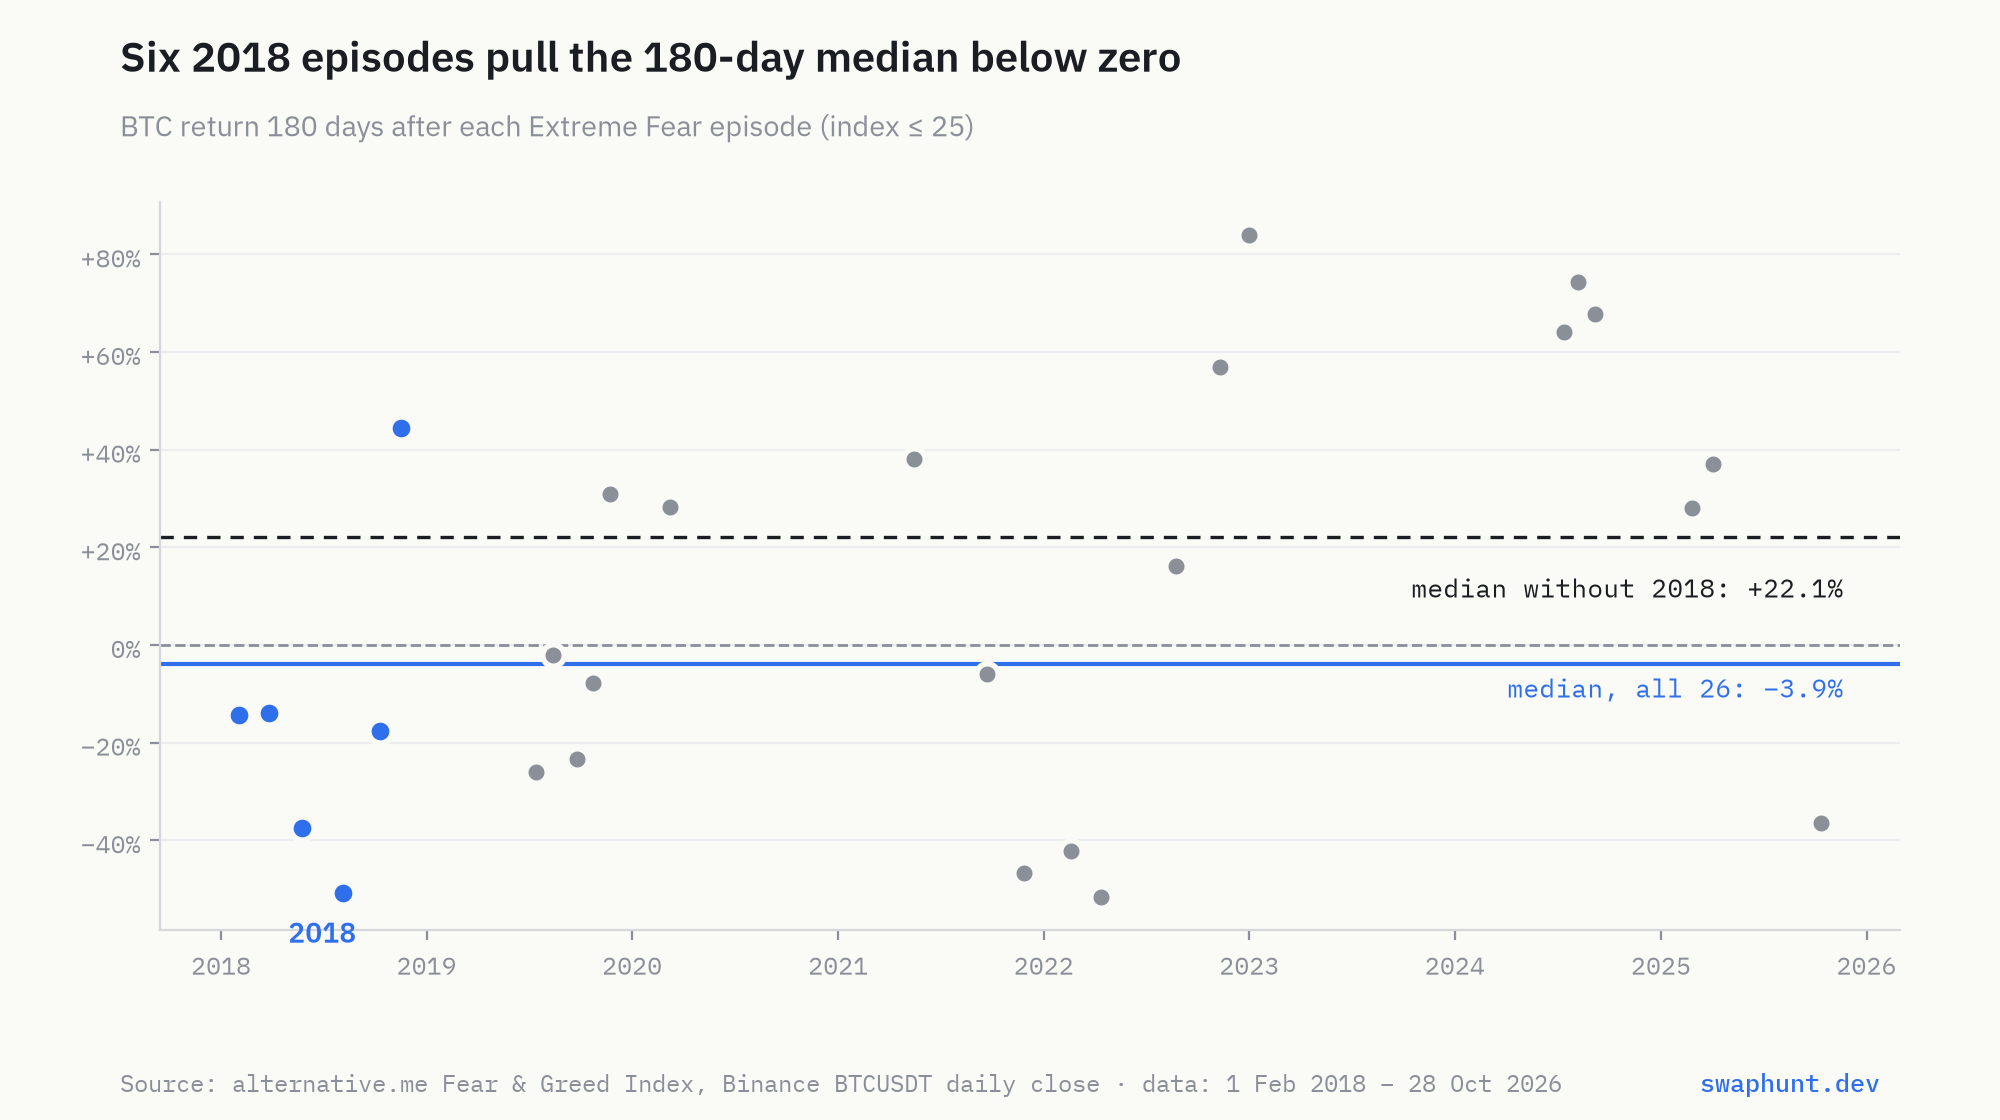
Yes, for the long horizon. Five of the six 2018 episodes were followed by losses over 180 days. With all 26 episodes that have a full 180 days of data, the median is −3.9%. Remove 2018 and it becomes +22.1%. Remove any other single year and it stays between −7.7% and +22.1%.
So the headline “Extreme Fear was followed by losses” depends on 2018. What happens to the comparison that matters? Without 2018 (21 episodes), Extreme Fear and the same drop without it come out roughly level. The fear episodes were slightly behind after 7 and 30 days (−1.6% against −0.4%, and −1.4% against +1.0%) and slightly ahead after 90 and 180 days (+4.2% against +2.4%, and +22.1% against +17.6%). All of it is well within the noise. With or without 2018, there is no sign that the fear told you more than the price did.
Robustness
| Variant | Episodes | Median after 7 / 30 / 90 / 180 days |
|---|---|---|
| Main (index ≤ 25, 14-day gap) | 27 | −2.1% / +0.3% / −9.1% / −3.9% |
| Stricter threshold (index below 20) | 26 | −1.0% / −1.1% / −4.0% / −9.1% |
| 7-day gap between episodes | 35 | −1.2% / −1.4% / −4.3% / −5.8% |
| 30-day gap between episodes | 14 | −4.8% / −7.2% / −10.8% / −14.0% |
No variant beats all days at any horizon. The size moves with the definition, as you would expect from so few episodes. The direction does not.
We also checked whether the “same drop” days were simply the days just before or after an episode. Between 37.2% and 37.8% of the matched days, depending on the horizon, were within 14 days of an episode. Excluding those days from the comparison makes it sharper, not weaker: the same-drop days then returned +0.5%, +2.1%, +7.4% and +27.6% after 7, 30, 90 and 180 days.
Every episode
The first day of each Extreme Fear episode, the index value that day, Bitcoin's change over the previous 30 days, and the return over the following 7, 30, 90 and 180 days. The last episode does not yet have 180 days of data.
| Date | Index | BTC change, previous 30 days | 7 days | 30 days | 90 days | 180 days |
|---|---|---|---|---|---|---|
| 2018-02-02 | 15 | −40.5% | −2.1% | +29.8% | +9.9% | −14.3% |
| 2018-03-27 | 24 | −18.7% | −5.0% | +18.9% | −19.8% | −14.0% |
| 2018-05-25 | 25 | −15.9% | +0.9% | −17.7% | −12.5% | −37.5% |
| 2018-08-05 | 23 | +6.3% | −10.2% | +4.8% | −9.1% | −50.7% |
| 2018-10-11 | 19 | −0.7% | +5.9% | +2.9% | −36.6% | −17.6% |
| 2018-11-16 | 23 | −16.1% | −21.8% | −42.9% | −36.5% | +44.4% |
| 2019-07-15 | 16 | +23.0% | −4.6% | −7.3% | −23.7% | −26.0% |
| 2019-08-14 | 11 | −7.3% | +0.9% | +2.9% | −12.2% | −2.0% |
| 2019-09-25 | 15 | −18.7% | −0.8% | +2.7% | −13.9% | −23.3% |
| 2019-10-24 | 20 | −12.7% | +23.3% | −1.4% | +17.1% | −7.7% |
| 2019-11-22 | 20 | −2.7% | +6.5% | +3.2% | +32.0% | +30.9% |
| 2020-03-09 | 17 | −19.9% | −36.6% | −7.2% | +22.9% | +28.2% |
| 2021-05-16 | 20 | −24.3% | −25.4% | −13.5% | +1.4% | +38.1% |
| 2021-09-22 | 21 | −12.0% | −4.6% | +39.4% | +12.3% | −5.8% |
| 2021-11-27 | 21 | −9.7% | −10.2% | −7.3% | −28.3% | −46.6% |
| 2022-02-19 | 25 | −1.5% | −2.4% | +2.3% | −27.1% | −42.1% |
| 2022-04-12 | 20 | +6.1% | +3.5% | −27.6% | −50.2% | −51.5% |
| 2022-08-24 | 25 | +0.3% | −6.2% | −9.7% | −24.1% | +16.3% |
| 2022-11-10 | 22 | −7.7% | −5.2% | −2.7% | +30.5% | +57.0% |
| 2022-12-31 | 25 | −2.6% | +2.4% | +38.0% | +72.1% | +84.1% |
| 2024-07-12 | 25 | −15.2% | +15.2% | +1.4% | +4.2% | +64.2% |
| 2024-08-06 | 17 | +0.3% | +8.1% | +0.3% | +21.1% | +74.4% |
| 2024-09-06 | 22 | −2.1% | +12.1% | +16.4% | +79.7% | +67.9% |
| 2025-02-25 | 25 | −13.6% | −1.6% | −1.6% | +23.4% | +28.0% |
| 2025-04-03 | 25 | −4.7% | −4.3% | +15.2% | +30.8% | +37.1% |
| 2025-10-12 | 24 | −0.9% | −5.5% | −10.4% | −21.3% | −36.5% |
| 2026-05-19 | 25 | +4.1% | −1.2% | −18.1% | −16.0% | – |
And Extreme Greed?
Readers always ask. Over 14 Extreme Greed episodes, the median return was +2.6%, +2.5%, +19.7% and +18.1%. That looks like momentum. But with a 7-day gap between episodes (23 episodes) it turns negative after 30 and 90 days (−1.8% and −4.9%), and every interval crosses zero. Too few episodes, and the sign flips with the episode definition. We can't say anything.
Why it doesn't work
As described by alternative.me in October 2026 (archived copy), half of the index comes from Bitcoin's own price behaviour: volatility (25%) and momentum and volume (25%), both compared with the last 30 and 90 days. The rest is social media (15%), Bitcoin dominance (10%) and Google Trends (10%); a survey component is paused. When the index hits Extreme Fear, the drop has usually already happened. Our matched comparison asks exactly that question, and the answer is that the drop explains as much as the fear. The index is a mood ring for the last few weeks of price, not a forecast.
Extreme Fear also tends to arrive in clusters during bear markets. In 2018 and 2022, the first Extreme Fear was not the bottom. It was the start of a long series of them.
What this means for you
- Don't treat Extreme Fear as a buy button. In our data it did not beat the same drop without the fear, with or without 2018.
- If you buy dips, the dip is the information. The index adds nothing you can't see on the price chart.
- Expect a wide range. Over the next 180 days, the worst episode was −51.5%, and one in ten was up more than 66.1%.
- Plan for more than one. Extreme Fear came in clusters. If you buy the first one, have a plan for the fifth.
- Don't wait for it. Waiting for Extreme Fear did not reliably beat simply buying, in our data.
FAQ
Is Extreme Fear a good time to buy Bitcoin?
Not reliably. Across 27 episodes since 2018, Bitcoin's median return after Extreme Fear was no better than after the same price drop without Extreme Fear.
What is Extreme Fear on the Fear & Greed Index?
alternative.me labels index values of 25 and below as Extreme Fear and 76 and above as Extreme Greed. The index runs from 0 to 100 and is updated daily.
Does “be greedy when others are fearful” work in crypto?
Not as a mechanical rule based on this index. The price drop that comes before the fear explained as much of the later returns as the fear itself.
Is Extreme Greed a sell signal?
We can't tell. With 14 episodes, the result changes sign depending on how episodes are defined.
Why do you use medians and not averages?
A few huge rallies can pull an average far away from what most episodes looked like. The median shows the typical outcome, and the intervals show how uncertain it is.
Methodology notes
Data: Crypto Fear & Greed Index (alternative.me), daily values 2018-02-01 to 2026-10-29, 3,189 days with 4 days missing in the source. Bitcoin: BTCUSDT daily candles from Binance's public market data (data-api.binance.vision), only completed days, last close 2026-10-28. Raw responses are stored with SHA256 hashes. Because the source terms do not clearly allow redistribution, the public repository contains the fetch script and derived data (episodes and returns), not the daily index values or prices.
Signal: an episode starts on the first day with an index value of 25 or below (Extreme Fear) or 76 or above (Extreme Greed) after at least 14 days outside the zone. Entry at the BTCUSDT close on the signal day; the index value is published at 00:00 UTC, so no future information is used. Returns are close-to-close over 7, 30, 90 and 180 calendar days. Episodes without a full horizon are left out for that horizon (26 Extreme Fear episodes at 180 days).
Comparisons: (1) all index days; (2) 10,000 draws of the same number of random days; (3) matched days: for each episode, a random day outside the zone with a 30-day trailing return within ±5 percentage points of the episode's, drawn 10,000 times. One episode (2018-02-02, after a 30-day drop of 40.5%) had only 8 matching days; all others had many more. A variant excluding days within 14 days of any episode gave the same conclusion. Without the 2018 episodes (21 left), episodes and matched days were roughly level at every horizon. Intervals are 95% bootstrap intervals of the median (10,000 resamples). Random seed 20261029.
Robustness: the brief's original thresholds (below 20, above 80), and 7- and 30-day gaps between episodes. Leave-one-year-out medians for every horizon.
Caveats: 27 episodes is a small sample. Episodes closer together than 90 or 180 days share part of the same price path, so the intervals at long horizons understate the uncertainty. We made 32 comparisons in total (2 zones, 4 horizons, 4 variants); a few will look striking by chance, and we do not report any single one as a finding. The index's methodology has changed over time without a public changelog. BTCUSDT on one exchange is not a global USD price, though the difference is small for daily closes. Nothing here is a trading rule or investment advice.
Scripts, data and the full list of episodes: https://github.com/swaphunt/research/tree/extreme-fear-v1/extreme-fear
Feelings are free. So is the price chart.